유전자 목록 TP53, MDM2, CDKN1A, BAX, GADD45A, BBC3, PMAIP1, FAS, SESN1, RRM2B 로 Reactome 경로 농축 분석을 해서, 보정 p 값 기준 상위 10개 경로를 표와 막대그래프로 정리해 줘.
K
완료
실행 과정 21단계 · 47초
-
진행에이전트를 준비하고 있습니다.
-
진행질문에 맞는 도구와 데이터를 고르고 있습니다.
-
진행도구 14개, 데이터 2개, 라이브러리 11개를 골랐습니다.
-
계획요청한 유전자들이 주로 p53 매개 DNA 손상 반응·세포사멸 축에 속하는지 확인하면서, Reactome의 과대표현 분석 결과를 다중검정 보정 p값(FDR)으로 정렬해 상위 10개를 표와 막대그래프로 만들겠습니다. 1. [ ] Reactome 과대표현 분석을 실행하고 보정 p값 결과를 확보한다. 2. [ ] 보정 p값 기준 상위 10개 경로를 정리하고 결과 테이블을 저장한다. 3. [ ] 상위 10개 경로의 막대그래프를 생성·저장하고 해석과 함께 제시한다.1. [ ] Reactome 과대표현 분석을 실행하고 보정 p값 결과를 확보한다. 2. [ ] 보정 p값 기준 상위 10개 경로를 정리하고 결과 테이블을 저장한다. 3. [ ] 상위 10개 경로의 막대그래프를 생성·저장하고 해석과 함께 제시한다.
-
코드 pythonpython
import requests, json, pandas as pd from pathlib import Path genes = ["TP53", "MDM2", "CDKN1A", "BAX", "GADD45A", "BBC3", "PMAIP1", "FAS", "SESN1", "RRM2B"] url = "https://reactome.org/AnalysisService/identifiers/projection" response = requests.post( url, data="\n".join(genes), headers={"Content-Type": "text/plain"}, timeout=60, ) print("Step 1 — Reactome analysis request") print("HTTP status:", response.status_code) response.raise_for_status() result = response.json() Path("reactome_analysis_raw.json").write_text(json.dumps(result, ensure_ascii=False, indent=2)) print("Analysis token:", result.get("summary", {}).get("token")) print("Found identifiers:", result.get("summary", {}).get("found")) print("Submitted identifiers:", result.get("summary", {}).get("total")) print("Raw response saved: reactome_analysis_raw.json") -
실행 결과
실행 결과 보기
Step 1 — Reactome analysis request
HTTP status: 200
Analysis token: MjAyNjExMjAwNDA2MThfMTQ1ODE%3D
Found identifiers: None
Submitted identifiers: None
Raw response saved: reactome_analysis_raw.json
-
파일reactome_analysis_raw.json
-
계획Reactome 분석 요청은 성공했습니다. 반환 형식을 점검한 뒤 경로별 FDR 값을 추출하겠습니다. 1. [ ] Reactome 과대표현 분석을 실행하고 보정 p값 결과를 확보한다. (응답은 수신되었으며 결과 구조·경로 목록을 확인 중) 2. [ ] 보정 p값 기준 상위 10개 경로를 정리하고 결과 테이블을 저장한다. 3. [ ] 상위 10개 경로의 막대그래프를 생성·저장하고 해석과 함께 제시한다.
-
코드 pythonpython
import json from pathlib import Path result = json.loads(Path("reactome_analysis_raw.json").read_text()) print("Step 1 — Inspecting Reactome response structure") print("Top-level keys:", list(result.keys())) for key, value in result.items(): if isinstance(value, dict): print(f"{key}: dict keys = {list(value.keys())[:20]}") elif isinstance(value, list): print(f"{key}: list length = {len(value)}") if value: print(f" first item keys/value: {list(value[0].keys()) if isinstance(value[0], dict) else str(value[0])[:500]}") else: print(f"{key}: {str(value)[:500]}") -
실행 결과
실행 결과 보기
Step 1 — Inspecting Reactome response structure
Top-level keys: ['summary', 'expression', 'identifiersNotFound', 'pathwaysFound', 'pathways', 'resourceSummary', 'speciesSummary', 'warnings']
summary: dict keys = ['token', 'projection', 'interactors', 'type', 'sampleName', 'text', 'includeDisease']
expression: dict keys = ['columnNames']
identifiersNotFound: 0
pathwaysFound: 220
pathways: list length = 220
  first item keys/value: ['stId', 'dbId', 'name', 'species', 'llp', 'entities', 'reactions', 'inDisease']
resourceSummary: list length = 3
  first item keys/value: ['resource', 'pathways', 'filtered']
speciesSummary: list length = 1
  first item keys/value: ['dbId', 'taxId', 'name', 'pathways', 'filtered']
warnings: list length = 1
  first item keys/value: Missing header. Using a default one.
-
계획Reactome는 10개 입력 유전자를 모두 인식했고 220개 관련 경로를 반환했습니다. 이제 각 경로의 통계 필드에서 FDR(보정 p값)을 추출하고, 유의도 순으로 상위 10개를 산출하겠습니다. 1. [✓] Reactome 과대표현 분석을 실행하고 보정 p값 결과를 확보한다. (10개 유전자 인식, 220개 경로 반환) 2. [ ] 보정 p값 기준 상위 10개 경로를 정리하고 결과 테이블을 저장한다. 3. [ ] 상위 10개 경로의 막대그래프를 생성·저장하고 해석과 함께 제시한다.
-
코드 pythonpython
import json from pathlib import Path result = json.loads(Path("reactome_analysis_raw.json").read_text()) print("Step 2 — Inspecting statistical fields for the first Reactome pathway") first = result["pathways"][0] print(json.dumps(first, ensure_ascii=False, indent=2)[:5000]) -
실행 결과
실행 결과 보기
Step 2 — Inspecting statistical fields for the first Reactome pathway { "stId": "R-HSA-3700989", "dbId": 3700989, "name": "Transcriptional Regulation by TP53", "species": { "dbId": 48887, "taxId": "9606", "name": "Homo sapiens" }, "llp": true, "entities": { "resource": "TOTAL", "total": 488, "found": 22, "ratio": 0.02998463901689708, "pValue": 1.1102230246251565e-16, "fdr": 6.772360450213455e-15, "exp": [] }, "reactions": { "resource": "TOTAL", "total": 258, "found": 193, "ratio": 0.015956459892386667 }, "inDisease": false } -
계획통계 필드에서 `entities.fdr`을 보정 p값으로 확인했습니다. 계층적 Reactome 결과에 포함된 전체 경로를 대상으로 FDR 오름차순 정렬 후 상위 10개를 저장하고, 막대 길이는 해석이 쉬운 `−log10(FDR)`로 표시하겠습니다. 1. [✓] Reactome 과대표현 분석을 실행하고 보정 p값 결과를 확보한다. (10개 유전자 인식, 220개 경로 반환) 2. [ ] 보정 p값 기준 상위 10개 경로를 정리하고 결과 테이블을 저장한다. (FDR 필드 확인 완료, 정렬·저장 진행) 3. [ ] 상위 10개 경로의 막대그래프를 생성·저장하고 해석과 함께 제시한다.
-
코드 pythonpython
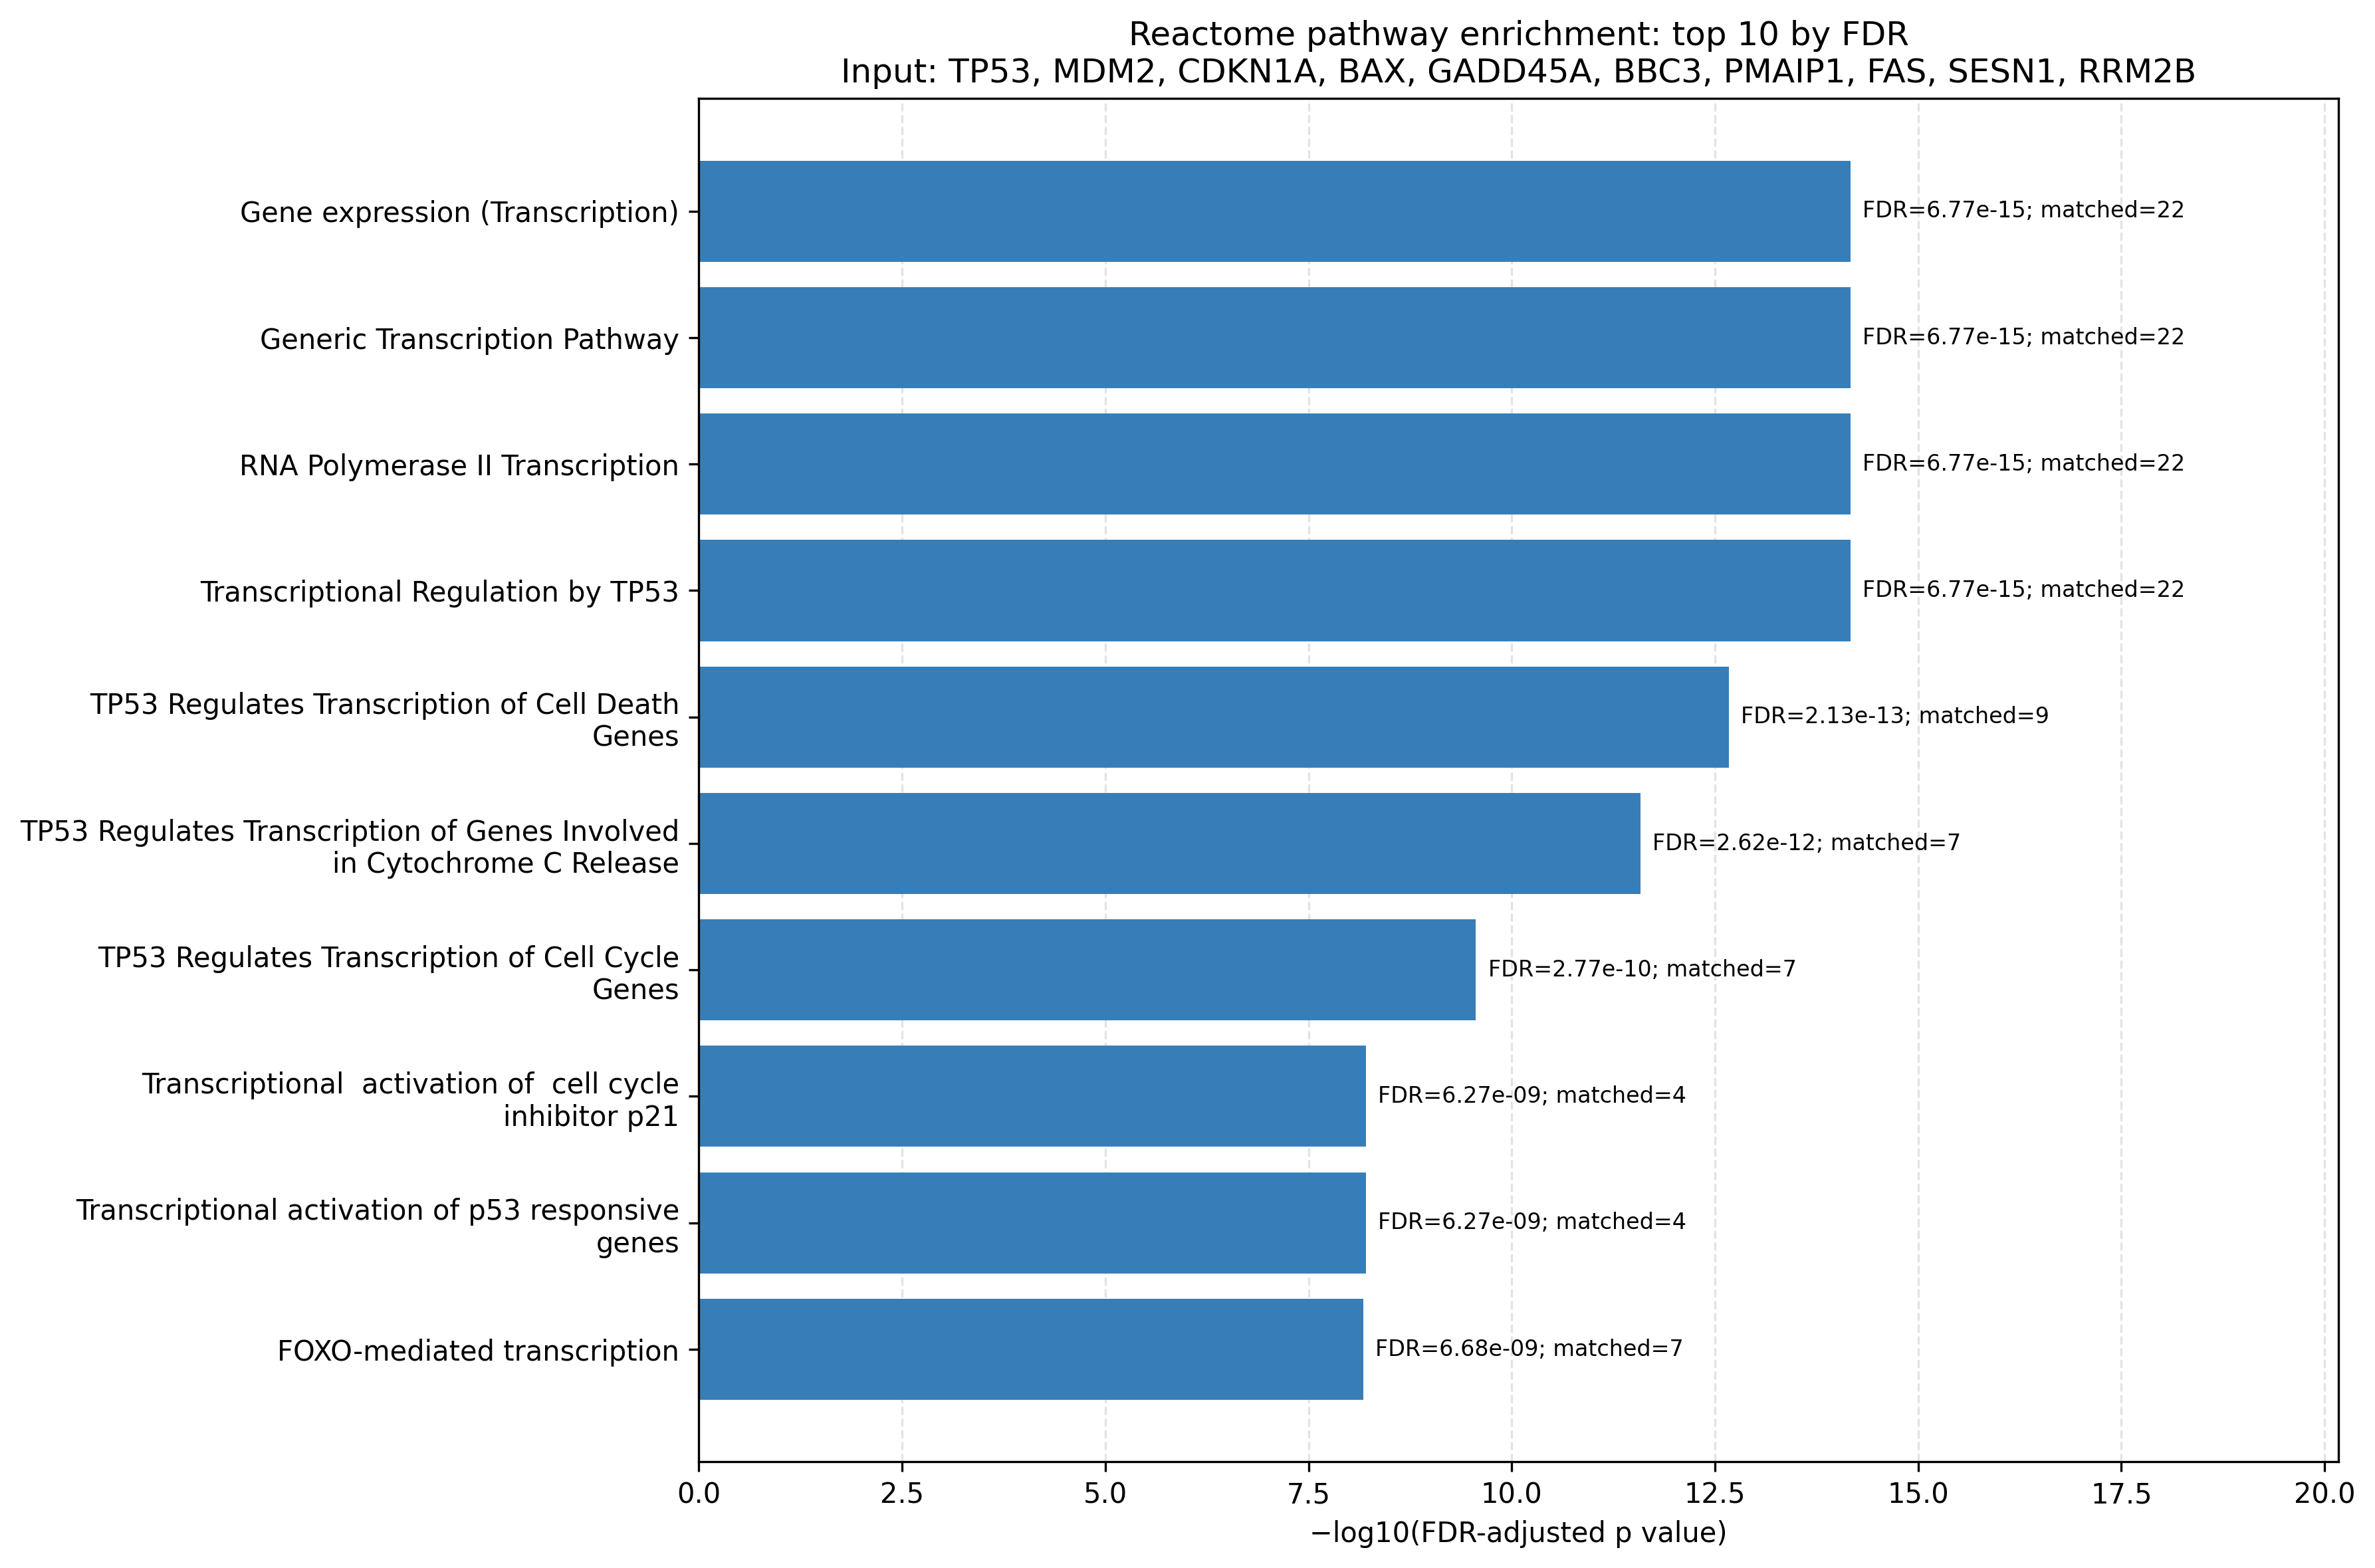
import json from pathlib import Path import pandas as pd import numpy as np import matplotlib.pyplot as plt import textwrap result = json.loads(Path("reactome_analysis_raw.json").read_text()) rows = [] for p in result["pathways"]: e = p.get("entities", {}) if e.get("fdr") is not None: rows.append({ "Reactome_ID": p["stId"], "Pathway": p["name"], "FDR_adjusted_p_value": e["fdr"], "Nominal_p_value": e.get("pValue"), "Matched_Reactome_entities": e.get("found"), "Pathway_Reactome_entities": e.get("total"), "In_disease": p.get("inDisease", False), }) df = pd.DataFrame(rows).sort_values( ["FDR_adjusted_p_value", "Nominal_p_value", "Pathway"], ascending=[True, True, True] ).reset_index(drop=True) top10 = df.head(10).copy() top10.insert(0, "Rank", range(1, len(top10)+1)) top10["FDR_adjusted_p_value"] = top10["FDR_adjusted_p_value"].astype(float) top10["Nominal_p_value"] = top10["Nominal_p_value"].astype(float) top10.to_csv("reactome_top10_FDR_enrichment.csv", index=False, encoding="utf-8-sig") top10.to_excel("reactome_top10_FDR_enrichment.xlsx", index=False) # Horizontal bar plot: values are -log10(FDR); cap at machine precision only for display plot_df = top10.iloc[::-1].copy() plot_df["minus_log10_FDR"] = -np.log10(np.maximum(plot_df["FDR_adjusted_p_value"], np.finfo(float).tiny)) labels = [textwrap.fill(x, width=46) for x in plot_df["Pathway"]] fig, ax = plt.subplots(figsize=(12, 8)) bars = ax.barh(labels, plot_df["minus_log10_FDR"], color="#377eb8") ax.set_xlabel("−log10(FDR-adjusted p value)") ax.set_title("Reactome pathway enrichment: top 10 by FDR\nInput: TP53, MDM2, CDKN1A, BAX, GADD45A, BBC3, PMAIP1, FAS, SESN1, RRM2B") ax.grid(axis="x", linestyle="--", alpha=0.35) ax.set_axisbelow(True) for bar, fdr, found in zip(bars, plot_df["FDR_adjusted_p_value"], plot_df["Matched_Reactome_entities"]): ax.text(bar.get_width() + 0.15, bar.get_y() + bar.get_height()/2, f"FDR={fdr:.2e}; matched={found}", va="center", fontsize=8) ax.set_xlim(0, plot_df["minus_log10_FDR"].max() + 6) plt.tight_layout() fig.savefig("reactome_top10_FDR_enrichment_barplot.png", dpi=300, bbox_inches="tight") fig.savefig("reactome_top10_FDR_enrichment_barplot.pdf", bbox_inches="tight") plt.close(fig) print("Step 2 — Top 10 Reactome pathways sorted by FDR") print(top10.to_string(index=False, formatters={ "FDR_adjusted_p_value": "{:.3e}".format, "Nominal_p_value": "{:.3e}".format })) print("\nSaved table: reactome_top10_FDR_enrichment.csv and .xlsx") print("Saved plot: reactome_top10_FDR_enrichment_barplot.png and .pdf") -
실행 결과
실행 결과 보기
Step 2 — Top 10 Reactome pathways sorted by FDR Rank Reactome_ID Pathway FDR_adjusted_p_value Nominal_p_value Matched_Reactome_entities Pathway_Reactome_entities In_disease 1 R-HSA-74160 Gene expression (Transcription) 6.772e-15 1.110e-16 22 1924 False 2 R-HSA-212436 Generic Transcription Pathway 6.772e-15 1.110e-16 22 1575 False 3 R-HSA-73857 RNA Polymerase II Transcription 6.772e-15 1.110e-16 22 1679 False 4 R-HSA-3700989 Transcriptional Regulation by TP53 6.772e-15 1.110e-16 22 488 False 5 R-HSA-5633008 TP53 Regulates Transcription of Cell Death Genes 2.132e-13 4.441e-15 9 83 False 6 R-HSA-6803204 TP53 Regulates Transcription of Genes Involved in Cytochrome C Release 2.625e-12 6.561e-14 7 33 False 7 R-HSA-6791312 TP53 Regulates Transcription of Cell Cycle Genes 2.765e-10 8.133e-12 7 66 False 8 R-HSA-69895 Transcriptional activation of cell cycle inhibitor p21 6.270e-09 2.322e-10 4 6 False 9 R-HSA-69560 Transcriptional activation of p53 responsive genes 6.270e-09 2.322e-10 4 6 False 10 R-HSA-9614085 FOXO-mediated transcription 6.681e-09 2.784e-10 7 110 False Saved table: reactome_top10_FDR_enrichment.csv and .xlsx Saved plot: reactome_top10_FDR_enrichment_barplot.png and .pdf -
파일reactome_top10_FDR_enrichment.csv
-
파일reactome_top10_FDR_enrichment.xlsx
-
파일reactome_top10_FDR_enrichment_barplot.pdf
-
파일reactome_top10_FDR_enrichment_barplot.png
-
계획분석과 파일 저장을 완료했습니다. 1. [✓] Reactome 과대표현 분석을 실행하고 보정 p값 결과를 확보한다. (10개 유전자 인식, 220개 경로 반환) 2. [✓] 보정 p값 기준 상위 10개 경로를 정리하고 결과 테이블을 저장한다. 3. [✓] 상위 10개 경로의 막대그래프를 생성·저장하고 해석과 함께 제시한다.
## Reactome 경로 농축 분석 결과
입력 유전자: **TP53, MDM2, CDKN1A, BAX, GADD45A, BBC3, PMAIP1, FAS, SESN1, RRM2B**
Reactome 분석에서 총 **220개 경로**가 반환되었고, 아래는 **FDR 보정 p값(Benjamini–Hochberg 방식의 Reactome 제공 FDR)** 기준 상위 10개입니다.
`Matched Reactome entities`는 해당 경로에 매핑된 입력 유전자 관련 Reactome 엔터티 수입니다.
|순위|Reactome ID|경로|FDR 보정 p값|명목 p값|매핑 엔터티 수|경로 전체 엔터티 수|
|---:|---|---|---:|---:|---:|---:|
|1|R-HSA-74160|Gene expression (Transcription)|6.772e-15|1.110e-16|22|1,924|
|2|R-HSA-212436|Generic Transcription Pathway|6.772e-15|1.110e-16|22|1,575|
|3|R-HSA-73857|RNA Polymerase II Transcription|6.772e-15|1.110e-16|22|1,679|
|4|R-HSA-3700989|Transcriptional Regulation by TP53|6.772e-15|1.110e-16|22|488|
|5|R-HSA-5633008|TP53 Regulates Transcription of Cell Death Genes|2.132e-13|4.441e-15|9|83|
|6|R-HSA-6803204|TP53 Regulates Transcription of Genes Involved in Cytochrome C Release|2.625e-12|6.561e-14|7|33|
|7|R-HSA-6791312|TP53 Regulates Transcription of Cell Cycle Genes|2.765e-10|8.133e-12|7|66|
|8|R-HSA-69895|Transcriptional activation of cell cycle inhibitor p21|6.270e-09|2.322e-10|4|6|
|9|R-HSA-69560|Transcriptional activation of p53 responsive genes|6.270e-09|2.322e-10|4|6|
|10|R-HSA-9614085|FOXO-mediated transcription|6.681e-09|2.784e-10|7|110|
### 해석
- 결과는 입력 유전자 목록이 **TP53 중심 전사 조절 네트워크**에 매우 강하게 집중됨을 보여줍니다.
- 특히 **세포사멸 조절**(BAX, BBC3/PUMA, PMAIP1/NOXA, FAS), **미토콘드리아 cytochrome c 방출**, **세포주기 정지**(CDKN1A/p21, GADD45A), 그리고 **DNA 손상 스트레스 반응**(RRM2B, SESN1)이 핵심 축입니다.
- 상위의 넓은 전사 관련 경로들은 서로 계층적으로 중복되는 Reactome 경로이므로, 더 기전적으로 특이적인 결과는 4–9위의 **TP53 매개 세포사멸·세포주기 경로**입니다.
- FOXO 매개 전사는 TP53과 공유하는 스트레스 반응·세포주기·apoptosis 조절 유전자군을 반영하는 것으로 해석할 수 있습니다.
### 다운로드 파일
- [상위 10개 결과 CSV](sandbox:/work/sessions/example/reactome_top10_FDR_enrichment.csv)
- [상위 10개 결과 Excel](sandbox:/work/sessions/example/reactome_top10_FDR_enrichment.xlsx)
- [막대그래프 PNG](sandbox:/work/sessions/example/reactome_top10_FDR_enrichment_barplot.png)
- [막대그래프 PDF](sandbox:/work/sessions/example/reactome_top10_FDR_enrichment_barplot.pdf)
막대그래프의 x축은 **−log10(FDR 보정 p값)** 이며, 막대가 길수록 농축의 통계적 유의성이 높습니다.
reactome_analysis_raw.json
139 KB
reactome_top10_FDR_enrichment.csv
1.25 KB
reactome_top10_FDR_enrichment.xlsx
5.7 KB
reactome_top10_FDR_enrichment_barplot.pdf
20.9 KB
 reactome_top10_FDR_enrichment_barplot.png